
If you work in technology at one point or another, you have crossed paths with the Internet of Things. Globally, manufacturers and their supply chain partners have come to recognize the crucial importance of managing manufacturing data and the need to optimize asset utilization. Their ultimate goal being to monitor, optimize and reduce costs on manufacturing floors.
Successful product testing is critical to quality. This article describes the 6 steps to quickly and efficiently manage your manufacturing and test assets in an IoT Platform.
Step 1: Know What You’ve Got and Understand What You Need
Don’t take your current assets for granted. The first step is to do a complete inventory of the test assets you already own. It is important to follow a controlled process to document all your test and manufacturing resources.
Start by mapping the location, function, importance and approximate cost of these assets within the focused environment. Next, you need to understand the capability of each asset providing information (e.g. its data format, the data volume it produces, the type of available data, etc.). It is also key to understand who has responsibility over these assets. Finally, consider the type of logical engine that each asset bases itself on. Ask yourself what you need to know, for example:
- Is this a computer-based solution?
- Is it powered by a PLC (Programable Logic Controller) or something similar?
- Is it purely mechanical with on-off sensor type behavior?
| |
By creating an inventory of your current assets, you will gain visibility on where you are, and what it will take to get connected. Knowledge is power. When you know where you are, you can determine where you need to go. Every team has different priorities so your KPIs will vary from one group to the next. Get representatives from each team (operations, maintenance, purchasing, et al.) and define what each side needs and which KPIs have value for them.
Step 2: IT Infrastructure and IoT Platform
To connect assets to a network, you need to ensure that you have both the IT capability to manage the traffic, and an IoT platform to receive the data.
Consider the amount of data (per day, per hour, per minute) that will be generated by the existing assets, whether it be in the lab or in the plant. Some statistical data will be available from IT but cannot offer a complete picture. Some assets will inevitably be missed, and the increased amount of data that will be generated by the addition of any new system will be difficult to predict. Some legwork will be required to understand the overall state of affairs, in addition to forecast the future usage. This information will allow users to plan for proper bandwidth and data storage and what makes the choice of a proper IoT platform essential. At the end of the day you need the right tool to distribute the right information to the right people.
| |
Step 3: It’s Go Time
The 3rd step will be to build your implementation strategy. It is now time to prioritize assets, production lines and test functions that will be implemented through each phase. This will include the capabilities of your IT infrastructure that you have already identified, as it goes hand-in-hand with your smart connected operations deployment. For a successful launch, consider the following:
Build a Strong Foundation
Start with the machines or the lines that are the most critical according to your strategy. Generally, this is where the largest ROI will be seen. Start by asking yourself:
- Which assets are the cost me the most?
- Which machines require the most repairs or maintenance?
- Which production line is most crucial and/or has the highest impact on your ROI?
These simple questions will help you select your starting point. The initial action plan is usually to create an improved maintenance environment. From there, implementation will require the appropriate structure, information and commitment.
Get Connected
Now is the time to define the asset types and assign data per asset. In some cases, you will need to add a connectivity sensor or a software bridge to link the different hardware platforms to the IoT environment. In other cases, the data already resides in an existing business system and a bridge from that system will facilitate its integration.
Step 4: Analyze This
The best way to summarize your data is to create a visualization dashboard allowing you to focus on the most important KPIs. Assets are expensive, hence the necessity of monitoring their actual utilization. Having centralized and consolidated data offers a complete picture leading to faster issue resolution and overall improvement in product quality.
The following is an example of a customized dashboard, offering overall performance visibility using Averna’s, a PTC ThingWorx Platinum Partner, ConnexThing Toolkit.
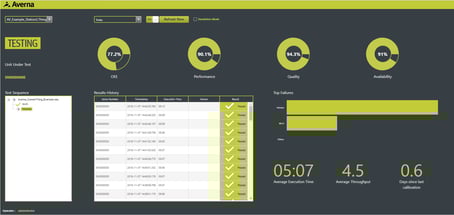
On your dashboard, you select which information is most valuable and it’s delivered in real time. This can include different part numbers going through the asset, test results or additional KPIs like Takt Time, throughput, top failures, etc.
Ultimately, you want easy access to the OEE (Overall Equipment Effectiveness), the ability to monitor and optimize your line throughput, and quickly identify failure causes. These are the main drivers towards continuous improvement.
Click Here for a Free 90-Day Trial of this Software toolkit.
| |
Step 5: Increase and Optimize Datasets Produced
Now that you are connected, take a step back and ask what information is missing to make better decisions globally? Consulting with other team members from operations and maintenance will help define what can continue to be improved.
You may decide to include data sets coming from your suppliers. You could also link information related to the physical manufacturing environment (e.g. location, power stability, temperature, etc.). You may simply want to connect an asset that is currently disconnected or add a step in your process to capture insights on an area where you are blind now.
Optimization is an on-going project and evolves with your business.
Step 6: Machine Learning
The final step is to enable machine learning by adding artificial intelligence to your environment.
The objective of machine learning was initially to increase uptime thereby optimizing throughput. This is achieved through designing models for predictive and prescriptive maintenance of your assets.
However, the goal of increasing first pass yield is achievable simply by integrating test and quality data. This alone will help you obtain models for predictive and adaptable process control, allowing you to simplify process limits while maintaining quality.
The crucial element of machine learning is contextualized data. This is where an IoT platform really flexes its muscles, linking PLM, CAD, ERP and supplier data to the final data sets. The richer the data, the more you will save on operations inefficiencies.
Anything worth doing is worth doing right. Implementing an IoT platform into your existing environment can be daunting, but it is the future of manufacturing. With the proper preparation and by using the right tools, the investment you make in moving forward will quickly show its benefits throughout the entire product lifecycle.
For more information on Smart Manufacturing & Testing or to Speak with an Expert please contact Averna.