I love math. There is such a beauty in the non-subjective way that there can be only 1 right answer. I'm enjoying teaching my children that there are many ways to tackle a problem and all result in the same answer. As an FPGA developer there is a similar love of the determinism that environment provides. There is a reason for every change in state and event that occurs. Even if that reason may be frustratingly difficult to determine sometimes.
But in the world of DSP, the exact nature of math can begin to break down. Floating-point and fixed-point numbers are approximation of real-world values. The resolution of these numbers and the methods used in the conversions can add a layer of ambiguity. Make no mistake, the rules of math are not suddenly becoming debatable, just added conversions add before unaccounted for steps in the process.
This changes the ability to tackle a problem in multiple ways and regardless of method selected, get the exact same answer. For example, take an FFT operation on a collection of double-precision floating point numbers. The resolution of a double is very high but still has a limit. An operation that takes two doubles in and produces a double still has to produce a result that is resolved into the proper format and not a real world number. This rounding (or other) process changes the result, even if just slightly. During the FFT process there are various stages of multiplication and addition. Two different implementations of the algorithm might do the operations in two separate but equivalent orders. Each operation will require its own conversion of the results to doubles. This will result in slightly different double values in the process. The result of the two will match until you get deeper and deeper into resolution where they will deviate. This difference will be more noticeable as the number of bits is reduced, as is the case in fixed-point implementations.
So the task of unit testing is now not as straightforward. We cannot simply verify that our fixed-point FPGA algorithm produces the exact same number as the floating-point host model. How do we quantify that the results are acceptable? There are many different approaches used and selection can be based on the type of algorithm. Some common approaches:
- Results are within +/- 1 LSb
- Compare SNR of model and FPGA
- Statistical analysis of resulting distribution (i.e. histograms)
But in developing these algorithms there are more things that can go wrong outside of the math. A state-machine controlling the algorithm might have bugs. There might be issues in flow control causing overflow or underflows. The configuration data might be parsed incorrectly. The latency might not be properly compensated. These and many other issues can cause the resulting analysis to fail. But how are we going to determine what is wrong when all we know is the results are not within +/- 1 LSb? We need a first pass way to make sure all aspects of the algorithm are working together correctly.
A timing diagram, from a sampling probe, is a traditional and very insightful approach. It provides useful information on state changes and events. It's harder to use a timing diagram to check the correctness of the fixed-point data. That is why we have found our most useful first approach at testing these types of algorithms is something we call the 'Candy-Stripe' approach. The idea is to plot the FPGA fixed-point output on the same graph as the host model floating-point output creating a sort of waveform timing diagram. Obviously rocket science being used here!
When things are working the resulting graph shows a thick red line under a thinner white line (the "Candy-Stripe").
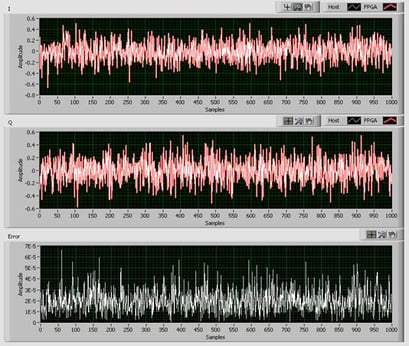
When it goes wrong there are two distinct lines.While it does not sound like much, there is an insight that can be obtained by seeing the two waveforms together that can't be determined by doing bit comparisons. Some examples:
- Finding an I/Q swap by noticing the 'I' red line more closely resembles the 'Q' white line (and vice versa)

- See the 'I' and/or 'Q' data is negated as the red and white lines become mirror images

- Noticing clipping in fixed-point data
- Determine that all or intermediate steps do not have enough fixed-point resolution as the red line looks like a noisy version of the white line

- Latency issues where the red line leads or lags the white line

- Dropped samples or intermittent issues were the lines mostly agree but deviate in certain areas
At Averna we have created standardized utilities to help quickly create candy-stripe unit tests. We have found they expedite our test creation process. The candy-stripe is so prevalent in the office that during algorithm development times in the project you can quickly look around at all the different developers monitors and get a feel for their success based on the status of the currently displayed candy stripe. "Did it candy-stripe?" is a common question in our scrums. A round of high fives are always warranted for both the envious "first pull candy-stripe" and the hard-fought battles that eventually find success.
A candy-stripe success is just part of the early steps in unit testing. After passing more advanced analysis is usually required.
– Andy Brown, Principal Systems Engineer at Averna